axis3dcut#
- snake.toolkit.plotting.axis3dcut(fig, ax, background, z_score, gt_roi=None, width_inches=7, cbar=True, cuts=None, bbox=None, slices=None, bg_cmap='gray')[source]#
Display a 3D image with zscore and ground truth ROI.
Examples using snake.toolkit.plotting.axis3dcut#

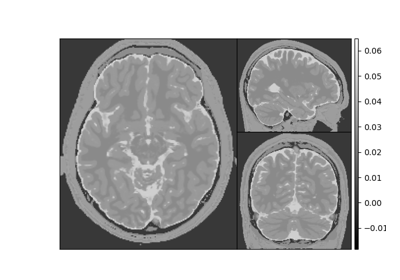
Generate a Phantom and visualize the contrast at different TE values
Generate a Phantom and visualize the contrast at different TE values

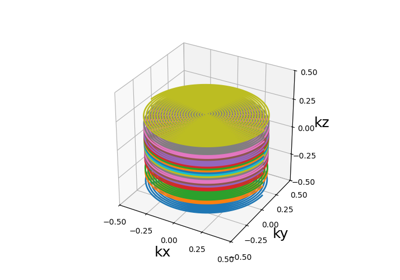
Compare Fourier Model and T2* Model for Stack of Spirals trajectory
Compare Fourier Model and T2* Model for Stack of Spirals trajectory


